A About datasets
A.1 Cell lines
Several analyses in previous chapters are based on data derived from cell lines. Among the different databases, the ones used in the thesis are briefly described below. Please refer to corresponding references for additional details.
A.1.1 Omics profiles
The omics profiles of cancer cell lines have been downloaded from Cell Model Passports (Meer et al. 2019) containing genotypic and phenotypic information about more than 1,000 cell lines. Among the available data used in this thesis are the exome sequencing, copy number variations and RNA-sequencing.
A.1.2 Drug screenings
Information about response to treatments is retrieved from Genomics of Drug Sensitivity in Cancer Database (GDSC, Yang et al. (2012)). In order to allow detailed analyses at the level of cancer types, we will restrict ourselves here to tissues represented by at least 20 cell lines and highlighted in dark grey in Figure A.1A. Most of the 663 cell lines in this subcohort have a complete profile with all omics data (mutations, CNA and expression) and drug responses. However, not all cell lines have necessarily been tested for all drugs.
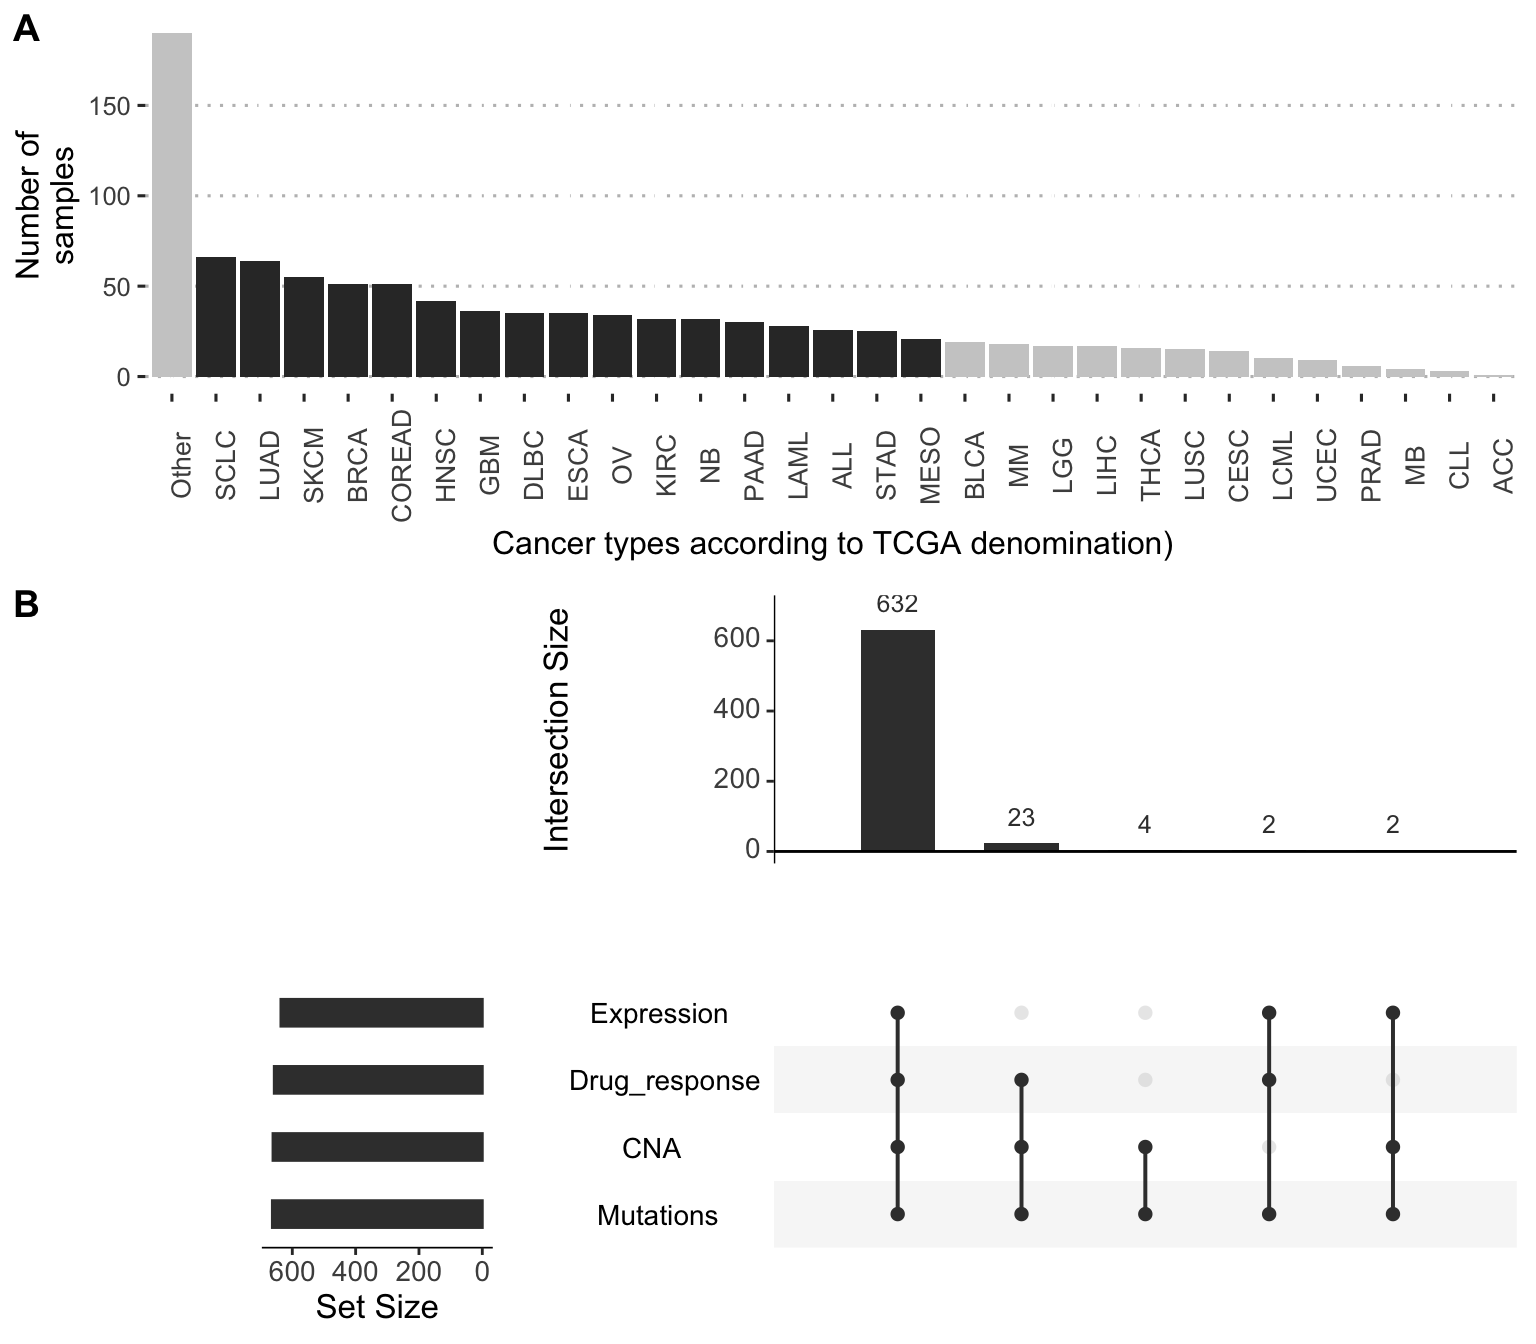
Figure A.1: Distribution of cancer types and data types in GDSC-associated dataset. (A) Distribution of cell lines per cancer types, highlighting the ones selected in this thesis with more than 20 cell lines. (B) Availibility of data for the 663 selected cell lines in 17 different cancer types.
The cell lines are treated with increasing concentration of drugs and the viability of the cell line relative to untreated control is measured. The dose-response relative viability curve is fitted and then used to compute the half maximal inhibitory concentration (\(IC_{50}\)) and the area under the dose-response curve (AUC) (Vis et al. 2016), both being represented in Figure A.2. Since the \(IC_{50}\) values are often extrapolated outside the concentration range actually tested, we will focus on the AUC metric for all validation with drug screening data. AUC is a value between 0 and 1: values close to 1 mean that the relative viability has not been decreased, and lower values correspond to increased sensitivity to inhibitions. In cases where the ranges of concentrations tested for different drugs vary, comparison of their AUC values does not have a simple and straightforward interpretation.
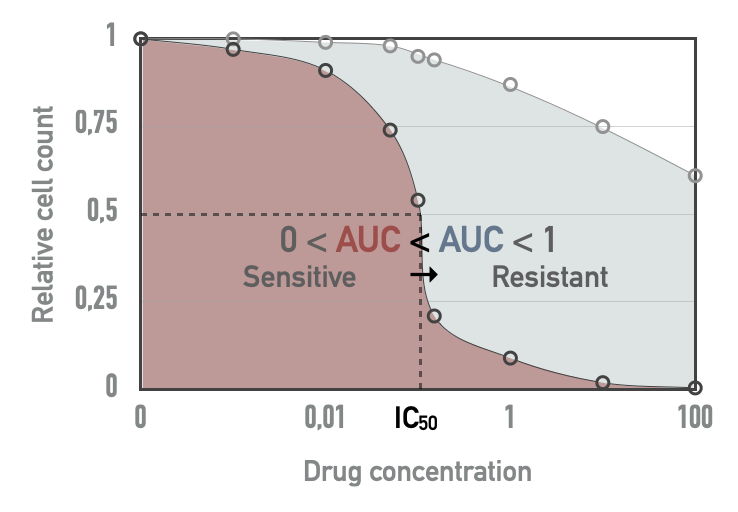
Figure A.2: Drug screening metrics in cell lines. Based on a tested drug concentration range, \(IC_{50}\) and area under the dose-response curve (AUC) can be computed. For a given drug, red AUC corresponds to a more sensitive cell line than blue AUC.
A.1.3 CRISPR-Cas9 screening
On top the previous drug response characterization, some CRISPR-Cas9 screenings have been performed on cancer cell lines. Very basically, this involves using single-guide RNAs (sgRNAs) to direct the targeted inhibition of certain genes. Conceptually, screening is not very different from drug screening since it allows the sensitivity of cell lines to the inhibition of certain targets to be studied. However, this technology makes it possible to target many more different genes since it is based on RNA guide synthesis and not on the existence of drugs with an affinity for the target of interest. Schematically, sreening is therefore broader (thousands of genes), less biased (any gene can be targeted a priori) and more precise (much lower off-target effect).
Among the various databases available, the ones used in this thesis have been downloaded from Cell Model Passports and come from Sanger Institute (Behan et al. 2019) and Broad Institute (Meyers et al. 2017). Both databases present CRISPR inhibition results for thousands of genes for a few hundred cell lines among those presented in the previous section. The Sanger dataset for instance includes 324 cell lines, and 238 in common with the subcohort previously described in the previous section and in Figure A.1.
Among the different metrics, the examples presented in this thesis will focus on scaled Bayesian factors to assess the effect of CRISPR targeting of genes. These scores are computed based on the fold change distribution of sgRNA (Hart and Moffat 2016). The highest values indicate that the targeted gene is essential to the cell fitness.
A.2 Patient-derived xenografts
Another type of data exists, halfway between cell lines and patients, and that is patient-derived xenografts (PDX). Each patient tumour is divided into pieces later implanted in several immunodeficient cloned mice treated with different drugs, thus providing access to sensitivities to several different drugs for each tumour.
A.2.1 Overview of PDX data from Gao et al. (2015)
The PDX dataset used in this thesis is the one published by Gao et al. (2015). The original dataset contains 281 different tumours of origin (sometimes called PDX models, in the sense of a biological model) and 63 tested drugs, not all drugs having been tested for all tumours and some drugs have been tested with tissue-specific patterns (Figure A.3). 192 of these tumours have also been characterized for their mutations, copy-number alterations and mRNA. More detailed analyses of this dataset are available in the dedicated Github repository, in the file Analysis_PDX.Rmd and its corresponding HTML report.
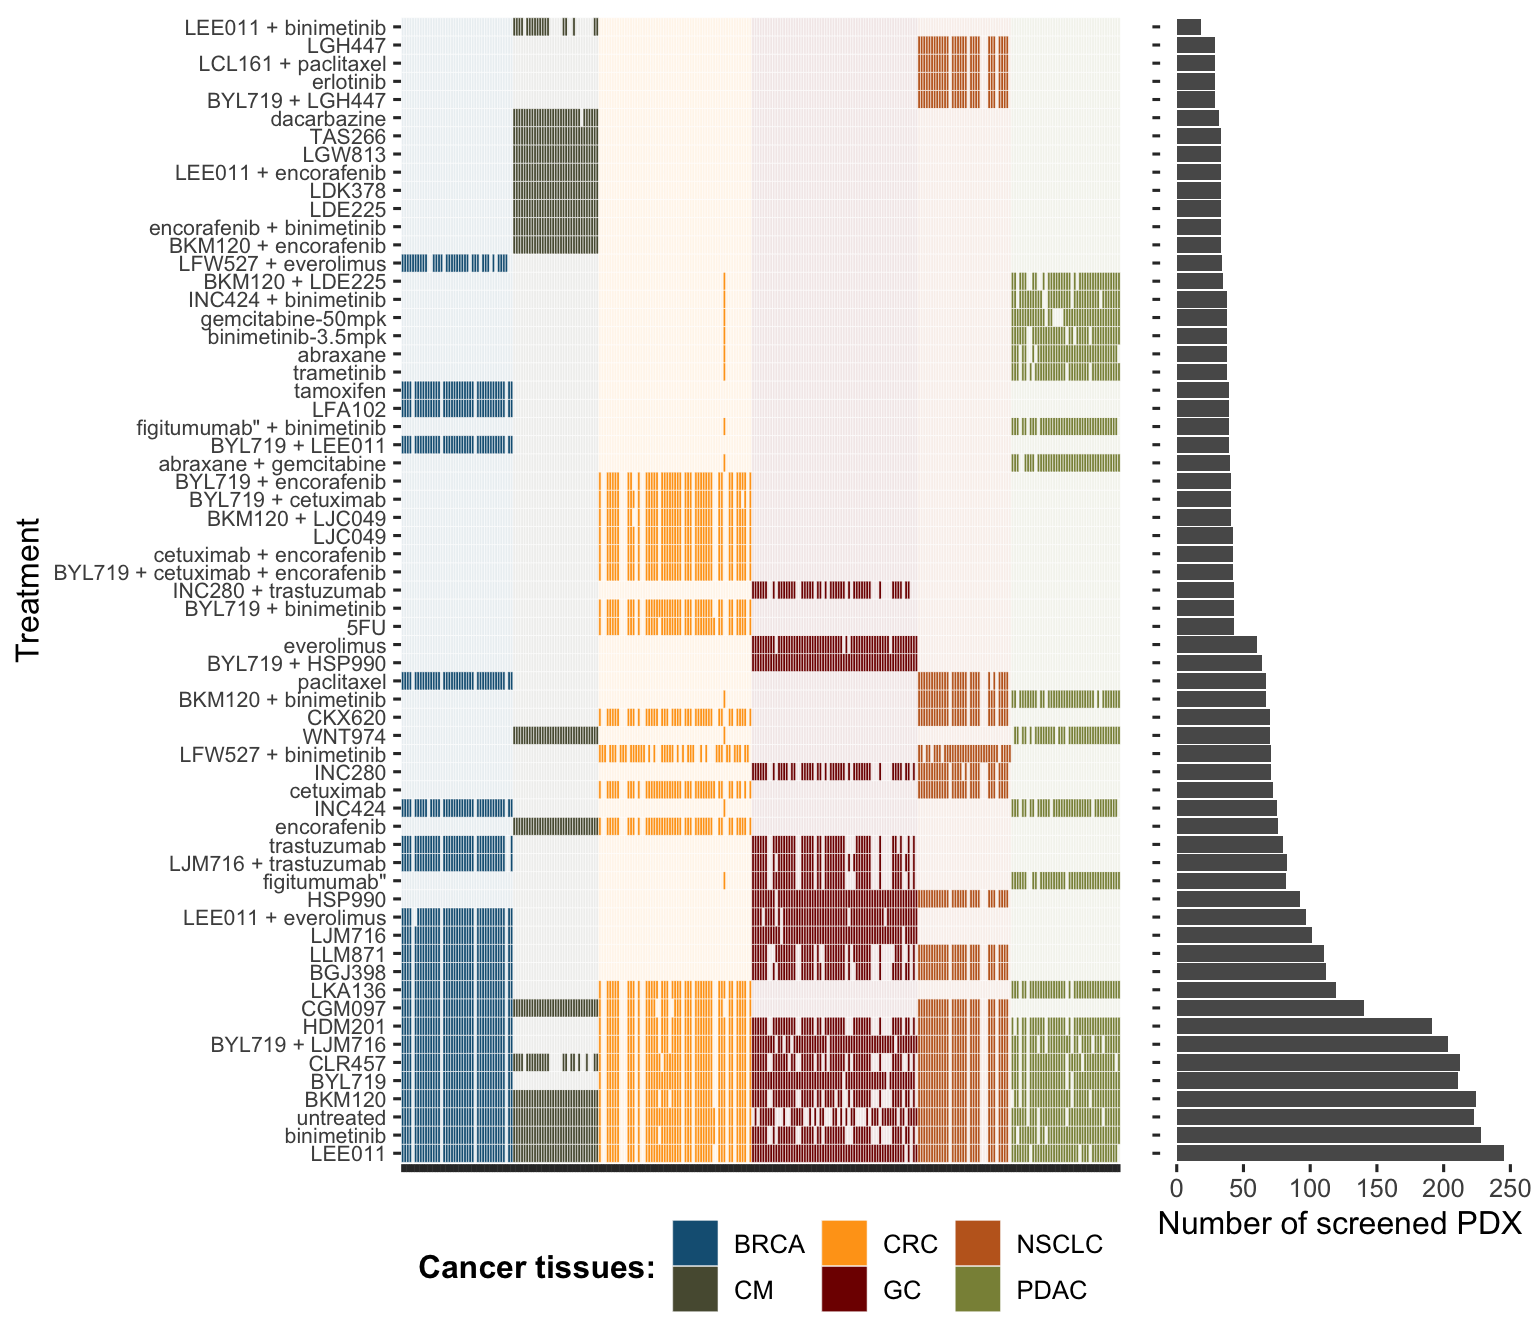
Figure A.3: Comprehensive overview of tumours and drugs screened in PDX dataset from Gao et al. (2015).
A.2.2 Drug response metrics
A.2.2.1 A continuous outcome
The first drug response metric used in this article is called Best Average Response. For each combination tumour/drug, the response is determined by comparing tumor volume change at time \(t\), \(V_t\) to tumor volume at time \(t_0\), \(V_{t_0}\). Several scores are computed:
\[\text{Tumour Volume Change (\%)} = \Delta Vol_t = 100\% \times \dfrac{V_t-V_{t_0}}{V_t}\]
\[\text{Best Response} = min(\Delta Vol_t), t>10d\]
\[\text{Average Response}_t = mean(\Delta Vol_i, 0 \leq i\leq t)\]
\[\text{Best Average Response} = min(\text{Average Response}_t), t>10d\]
We will mainly focus on Best Average Response. This metric "captures a combination of speed, strength and durability of response into a single value" (Gao et al. 2015). Qualitatively, lower values correspond to more efficient drugs.
A.2.2.2 A binary outcome
Thresholds of Best Response and Best Average Response are also defined, inspired by RECIST criteria (Therasse et al. 2000), in order to classify response to treatment into 4 categories: Complete Response (CR), Partial Response (PR, Stable Disease (SD) and Progressive Disease (PD). We designed a binary response status by combining the response categories (CR, PR and SD) into a single "responder"" category (1), opposed to the "non-responders" progressive diseases (0).
A.3 Patients
A.3.1 METABRIC
METABRIC dataset is large breast cancer dataset with more than 2'000 patients (Pereira et al. 2016). Mutations, CNA, expression (transcriptomics micro-array) and clinical data are available for a majority of patients (Figure A.4A), with 1'904 patients for whom all the data is available. One of the particular features of these data is to propose a very long clinical follow-up, over more than 10 years (Figure A.4B).
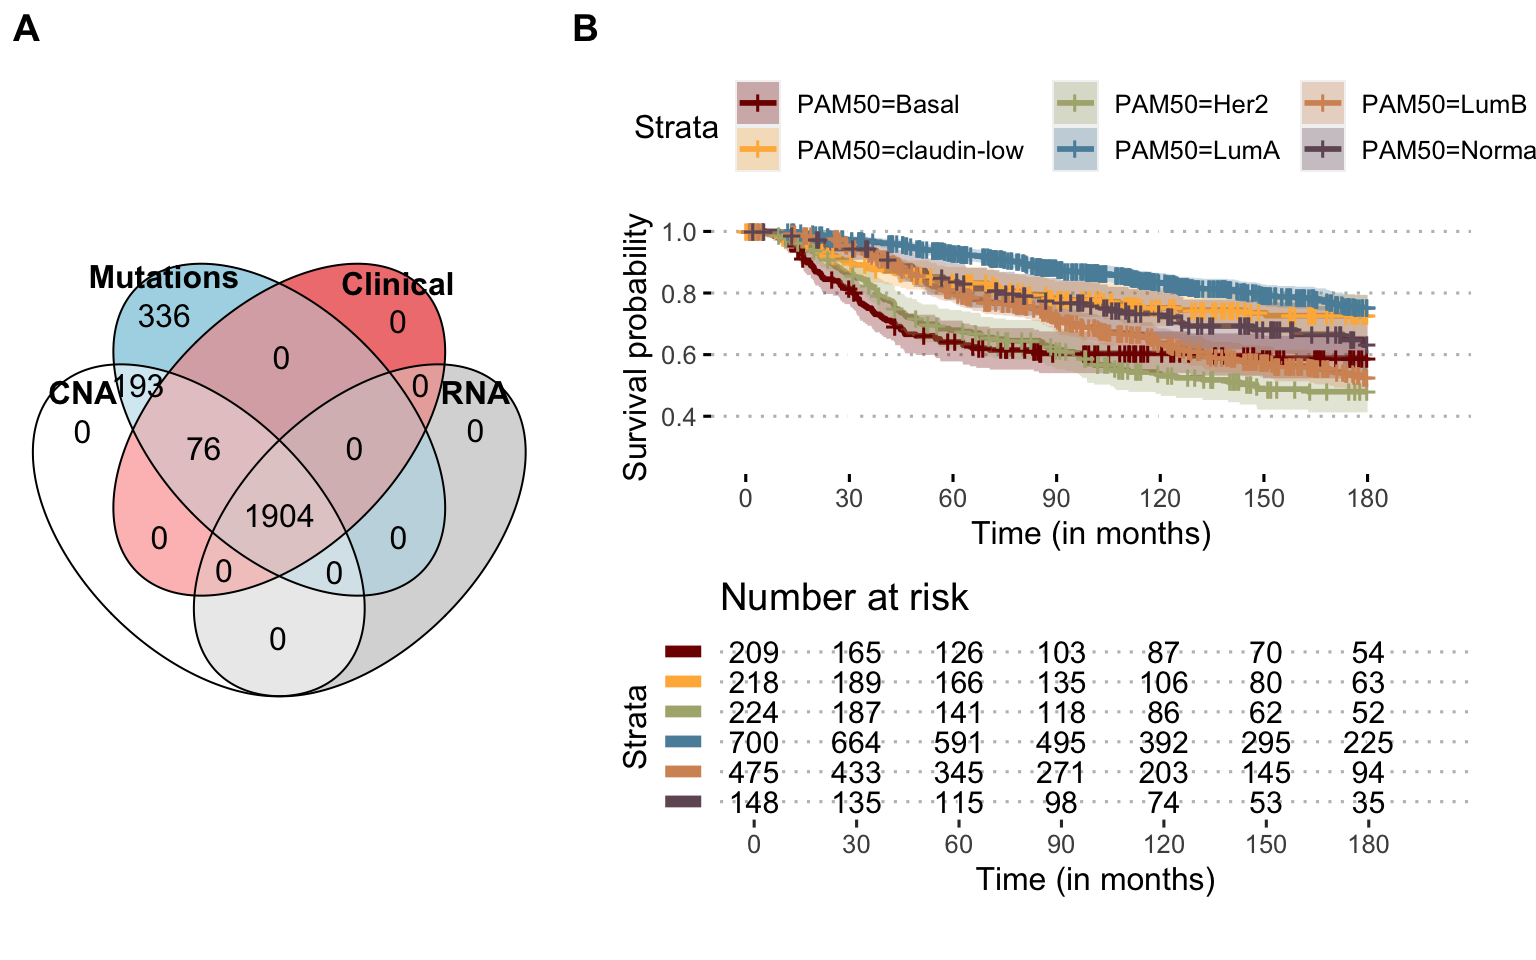
Figure A.4: Available omics and survival in METABRIC Breast Cancer dataset. (A) Number of patients for each omics type and their combinations, depicted as a Venn diagram. (B) Overall survival probability for all patients with clinical follow-up, stratified per breast cancer PAM50 subtype; administrative censoring at 180 months.
A.3.2 TCGA: Breast cancer
Another reference database for breast cancer is the one from the TCGA consortium (TCGA and others 2012). The cohort is smaller than METABRIC and its clinical follow-up is more limited. In contrast, the omics data are more comprehensive and include RNA sequencing and relative quantification of proteins with RPPA technology (Figure A.5A).
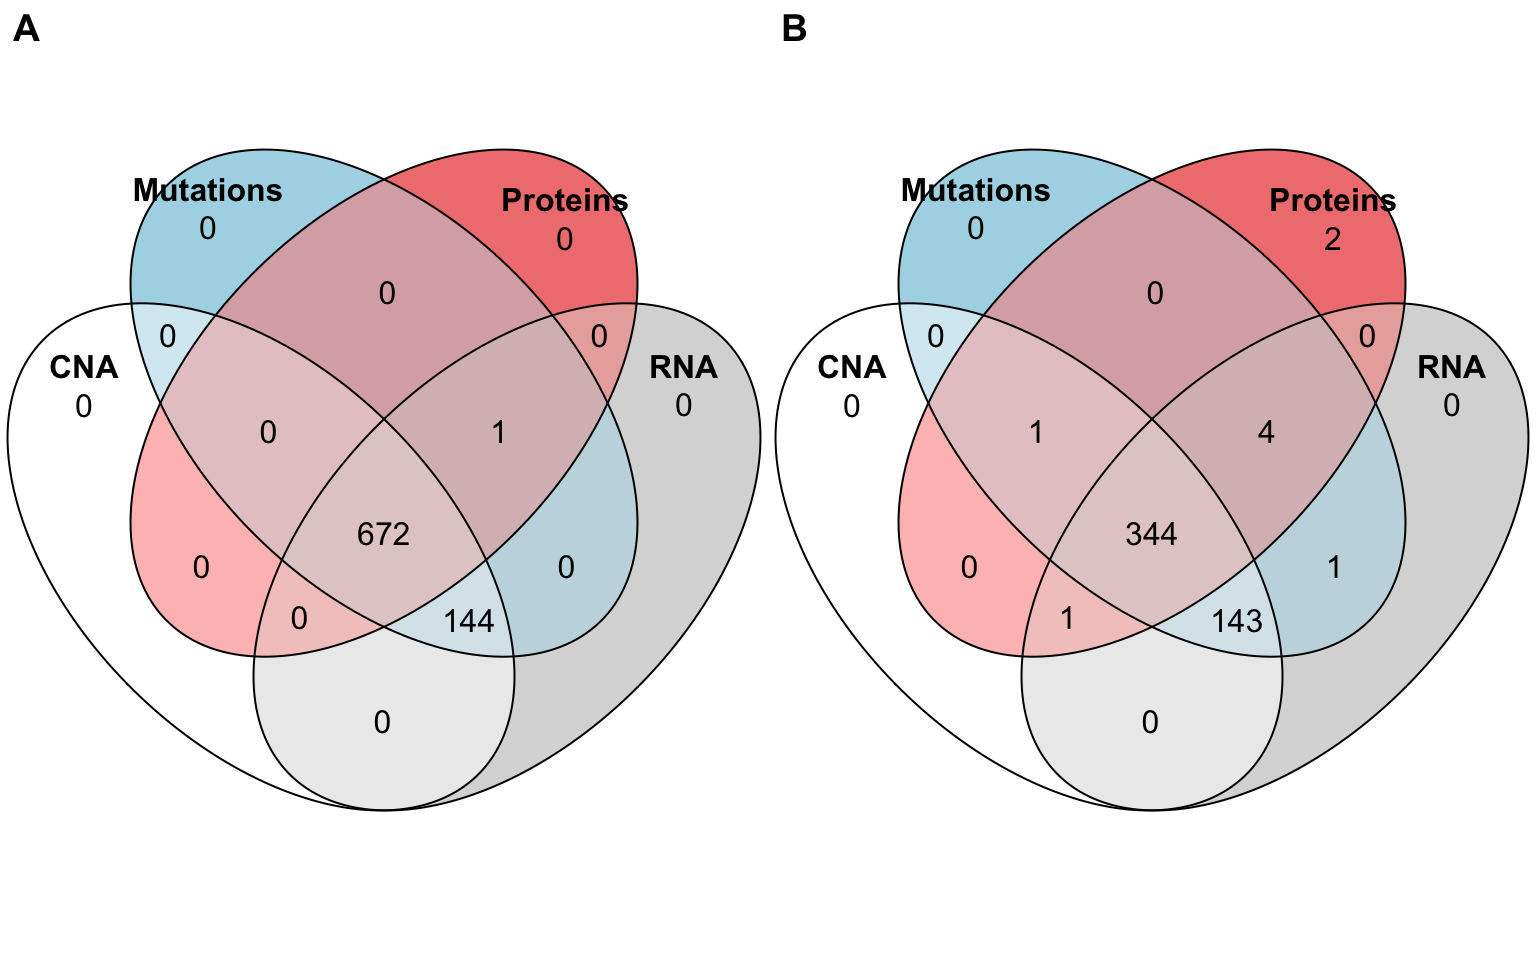
Figure A.5: Available omics for TCGA Breast and Prostate cancer. (A) Number of patients for each omics type and their combinations, depicted as a Venn diagram, in TCGA BRCA (Breast Invasive Carcinoma) study. (B) Same for the TCGA PRAD (Prostate Adenocarcinoma) study.
References
Abeshouse, Adam, Jaeil Ahn, Rehan Akbani, Adrian Ally, Samirkumar Amin, Christopher D Andry, Matti Annala, et al. 2015. “The Molecular Taxonomy of Primary Prostate Cancer.” Cell 163 (4). Elsevier: 1011–25.
Behan, Fiona M, Francesco Iorio, Gabriele Picco, Emanuel Gonçalves, Charlotte M Beaver, Giorgia Migliardi, Rita Santos, et al. 2019. “Prioritization of Cancer Therapeutic Targets Using Crispr–Cas9 Screens.” Nature 568 (7753). Nature Publishing Group: 511.
Gao, Hui, Joshua M Korn, Stéphane Ferretti, John E Monahan, Youzhen Wang, Mallika Singh, Chao Zhang, et al. 2015. “High-Throughput Screening Using Patient-Derived Tumor Xenografts to Predict Clinical Trial Drug Response.” Nature Medicine 21 (11). Nature Publishing Group: 1318.
Hart, Traver, and Jason Moffat. 2016. “BAGEL: A Computational Framework for Identifying Essential Genes from Pooled Library Screens.” BMC Bioinformatics 17 (1). Springer: 164.
Meer, Dieudonne van der, Syd Barthorpe, Wanjuan Yang, Howard Lightfoot, Caitlin Hall, James Gilbert, Hayley E Francies, and Mathew J Garnett. 2019. “Cell Model Passports—a Hub for Clinical, Genetic and Functional Datasets of Preclinical Cancer Models.” Nucleic Acids Research 47 (D1). Oxford University Press: D923–D929.
Meyers, Robin M, Jordan G Bryan, James M McFarland, Barbara A Weir, Ann E Sizemore, Han Xu, Neekesh V Dharia, et al. 2017. “Computational Correction of Copy Number Effect Improves Specificity of Crispr–Cas9 Essentiality Screens in Cancer Cells.” Nature Genetics 49 (12). Nature Publishing Group: 1779–84.
Pereira, Bernard, Suet-Feung Chin, Oscar M. Rueda, Hans-Kristian Moen Vollan, Elena Provenzano, Helen A. Bardwell, Michelle Pugh, et al. 2016. “The Somatic Mutation Profiles of 2,433 Breast Cancers Refines Their Genomic and Transcriptomic Landscapes.” Nature Communications 7 (May). doi:10.1038/ncomms11479.
TCGA, and others. 2012. “Comprehensive Molecular Portraits of Human Breast Tumours.” Nature 490 (7418). Nature Publishing Group: 61.
Therasse, Patrick, Susan G Arbuck, Elizabeth A Eisenhauer, Jantien Wanders, Richard S Kaplan, Larry Rubinstein, Jaap Verweij, et al. 2000. “New Guidelines to Evaluate the Response to Treatment in Solid Tumors.” Journal of the National Cancer Institute 92 (3). Oxford University Press: 205–16.
Vis, Daniel J, Lorenzo Bombardelli, Howard Lightfoot, Francesco Iorio, Mathew J Garnett, and Lodewyk FA Wessels. 2016. “Multilevel Models Improve Precision and Speed of Ic50 Estimates.” Pharmacogenomics 17 (7). Future Medicine: 691–700.
Yang, Wanjuan, Jorge Soares, Patricia Greninger, Elena J Edelman, Howard Lightfoot, Simon Forbes, Nidhi Bindal, et al. 2012. “Genomics of Drug Sensitivity in Cancer (Gdsc): A Resource for Therapeutic Biomarker Discovery in Cancer Cells.” Nucleic Acids Research 41 (D1). Oxford University Press: D955–D961.